RSI HistoAlert Strategy This simple indicator modified RSI
You can use in the xPrice any series: Open, High, Low, Close, HL2, HLC3, OHLC4 and ect...
You can change long to short in the Input Settings
Please, use it only for learning or paper trading. Do not for real trading.
Wyszukaj w skryptach "high low"

FX Sniper: T3-CCI Strategy Backtest This simple indicator gives you a lot of useful information - when to enter, when to exit
and how to reduce risks by entering a trade on a double confirmed signal.
You can use in the xPrice any series: Open, High, Low, Close, HL2, HLC3, OHLC4 and ect...
You can change long to short in the Input Settings
Please, use it only for learning or paper trading. Do not for real trading.

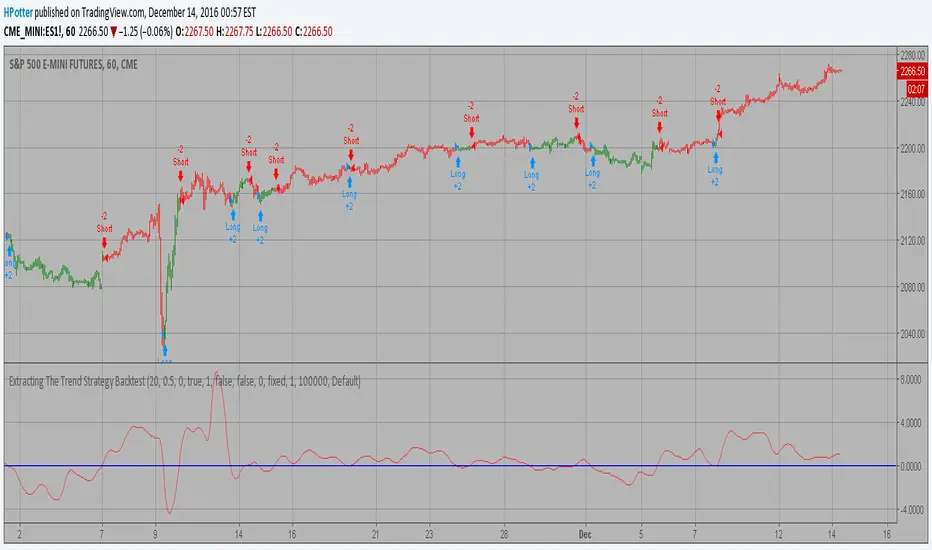
Extracting The Trend Strategy Backtest The related article is copyrighted material from Stocks & Commodities Mar 2010
You can use in the xPrice any series: Open, High, Low, Close, HL2, HLC3, OHLC4 and ect...
You can change long to short in the Input Settings
Please, use it only for learning or paper trading. Do not for real trading.
Ergotic TSI Strategy Backtest r - Length of first EMA smoothing of 1 day momentum 4
s - Length of second EMA smoothing of 1 day smoothing 8
u- Length of third EMA smoothing of 1 day momentum 6
Length of EMA signal line 3
Source of Ergotic TSI Close
This is one of the techniques described by William Blau in his book "Momentum,
Direction and Divergence" (1995). If you like to learn more, we advise you to
read this book. His book focuses on three key aspects of trading: momentum,
direction and divergence. Blau, who was an electrical engineer before becoming
a trader, thoroughly examines the relationship between price and momentum in
step-by-step examples. From this grounding, he then looks at the deficiencies
in other oscillators and introduces some innovative techniques, including a
fresh twist on Stochastics. On directional issues, he analyzes the intricacies
of ADX and offers a unique approach to help define trending and non-trending periods.
You can use in the xPrice any series: Open, High, Low, Close, HL2, HLC3, OHLC4 and ect...
You can change long to short in the Input Settings
Please, use it only for learning or paper trading. Do not for real trading.

Elder Ray (Bull Power) Strategy Backtest Developed by Dr Alexander Elder, the Elder-ray indicator measures buying
and selling pressure in the market. The Elder-ray is often used as part
of the Triple Screen trading system but may also be used on its own.
Dr Elder uses a 13-day exponential moving average (EMA) to indicate the
market consensus of value. Bull Power measures the ability of buyers to
drive prices above the consensus of value. Bear Power reflects the ability
of sellers to drive prices below the average consensus of value.
Bull Power is calculated by subtracting the 13-day EMA from the day's High.
Bear power subtracts the 13-day EMA from the day's Low.
You can use in the xPrice any series: Open, High, Low, Close, HL2, HLC3, OHLC4 and ect...
You can change long to short in the Input Settings
Please, use it only for learning or paper trading. Do not for real trading.

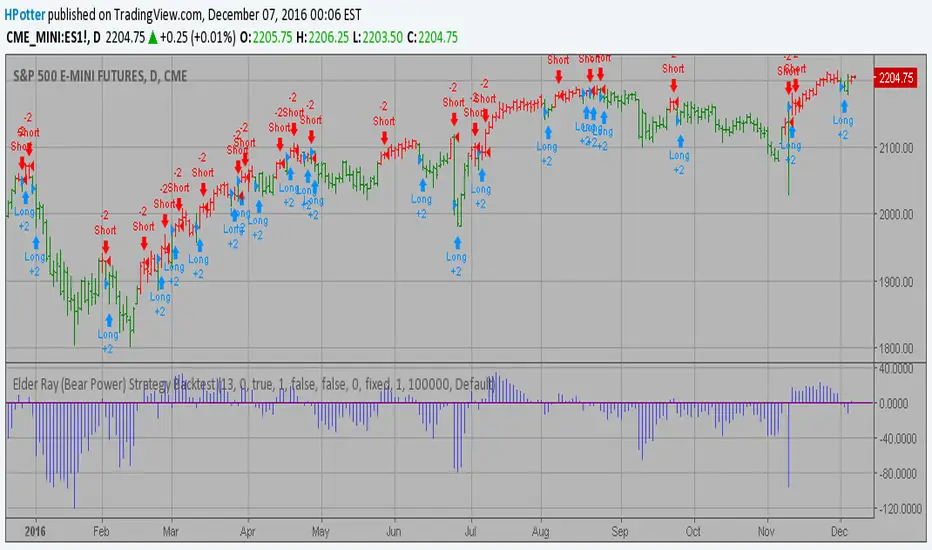
Elder Ray (Bear Power) Strategy Backtest Developed by Dr Alexander Elder, the Elder-ray indicator measures buying
and selling pressure in the market. The Elder-ray is often used as part
of the Triple Screen trading system but may also be used on its own.
Dr Elder uses a 13-day exponential moving average (EMA) to indicate the
market consensus of value. Bear Power measures the ability of sellers to
drive prices below the consensus of value. Bear Power reflects the ability
of sellers to drive prices below the average consensus of value.
Bull Power is calculated by subtracting the 13-day EMA from the day's High.
Bear power subtracts the 13-day EMA from the day's Low.
You can use in the xPrice any series: Open, High, Low, Close, HL2, HLC3, OHLC4 and ect...
You can change long to short in the Input Settings
Please, use it only for learning or paper trading. Do not for real trading.
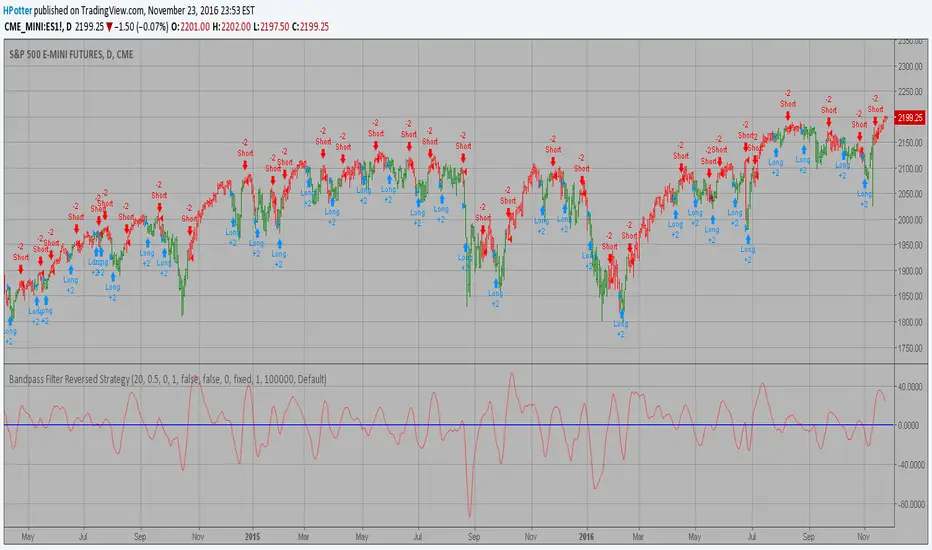
Bandpass Filter Reversed Strategy BacktestThe related article is copyrighted material from
Stocks & Commodities Mar 2010
You can use in the xPrice any series: Open, High, Low, Close, HL2, HLC3, OHLC4 and ect...
Please, use it only for learning or paper trading. Do not for real trading.
CamarillaStrategy -V1 - H4 and L4 breakout - exits addedExits added using trailing stops.
2.6 Profit Factor and 76% Profitable on SPY , 5M - I think it's a pretty good number for an automated strategy that uses Pivots. I don't think it's possible to add volume and day open price in relation to pivot levels -- that's what I do manually ..
Still trying to add EMA for exits.. it will increase profitability. You can play in pinescript with trailing stops entries..

S&D Light+ Enhanced# S&D Light+ Enhanced - Supply & Demand Zone Trading Strategy
## 📊 Overview
**S&D Light+ Enhanced** is an advanced Supply and Demand zone identification and trading strategy that combines institutional order flow concepts with smart money techniques. This strategy automatically identifies high-probability reversal zones based on Break of Structure (BOS), momentum analysis, and first retest principles.
## 🎯 Key Features
### Smart Zone Detection
- **Automatic Supply & Demand Zone Identification** - Detects institutional zones where price is likely to react
- **Multi-Candle Momentum Analysis** - Validates zones with configurable momentum requirements
- **Break of Structure (BOS) Confirmation** - Ensures zones are created only after significant structure breaks
- **Quality Filters** - Minimum zone size and ATR-based filtering to eliminate weak zones
### Advanced Zone Management
- **Customizable Zone Display** - Choose between Geometric or Volume-Weighted midlines
- **First Retest Logic** - Option to trade only the first touch of each zone for higher probability setups
- **Zone Capacity Control** - Maintains a clean chart by limiting stored zones per type
- **Visual Zone Status** - Automatically marks consumed zones with faded midlines
### Risk Management
- **Dynamic Stop Loss** - Positioned beyond zone boundaries with adjustable buffer
- **Risk-Reward Ratio Control** - Customizable R:R for consistent risk management
- **Entry Spacing** - Minimum bars between signals prevents overtrading
- **Position Sizing** - Built-in percentage of equity allocation
## 🔧 How It Works
### Zone Creation Logic
**Supply Zones (Selling Pressure):**
1. Strong momentum downward movement (configurable body-to-range ratio)
2. Identified bullish base candle (where institutions accumulated shorts)
3. Break of Structure downward (price breaks below recent swing low)
4. Zone created at the base candle's high/low range
**Demand Zones (Buying Pressure):**
1. Strong momentum upward movement
2. Identified bearish base candle (where institutions accumulated longs)
3. Break of Structure upward (price breaks above recent swing high)
4. Zone created at the base candle's high/low range
### Entry Conditions
**Long Entry:**
- Price retests a demand zone (touches top of zone)
- Rejection confirmed (close above zone)
- Zone hasn't been used (if "first retest only" enabled)
- Minimum bars since last entry respected
**Short Entry:**
- Price retests a supply zone (touches bottom of zone)
- Rejection confirmed (close below zone)
- Zone hasn't been used (if "first retest only" enabled)
- Minimum bars since last entry respected
## ⚙️ Customizable Parameters
### Display Settings
- **Show Zones** - Toggle zone visualization on/off
- **Max Stored Zones** - Control number of active zones (1-50 per type)
- **Color Customization** - Adjust supply/demand colors and transparency
### Zone Quality Filters
- **Momentum Body Fraction** - Minimum body size for momentum candles (0.1-0.9)
- **Min Momentum Candles** - Number of consecutive momentum candles required (1-5)
- **Big Candle Body Fraction** - Alternative single-candle momentum threshold (0.5-0.95)
- **Min Zone Size %** - Minimum zone height as percentage of price (0.01-5.0%)
### BOS Configuration
- **Swing Length** - Lookback period for structure identification (3-20)
- **ATR Length** - Period for volatility measurement (1-50)
- **BOS Required Break** - ATR multiplier for valid structure break (0.1-3.0)
### Midline Options
- **None** - No midline displayed
- **Geometric** - Simple average of zone top/bottom
- **CenterVolume** - Volume-weighted center based on highest volume bar in window
### Risk Management
- **SL Buffer %** - Additional space beyond zone boundary (0-5%)
- **Take Profit RR** - Risk-reward ratio for target placement (0.5-10x)
### Entry Rules
- **Only 1st Retest per Zone** - Trade zones only once for higher quality
- **Min Bars Between Entries** - Prevent overtrading (1-20 bars)
## 📈 Recommended Settings
### Conservative (Lower Frequency, Higher Quality)
```
Momentum Body Fraction: 0.30
Min Momentum Candles: 2-3
BOS Required Break: 0.8-1.0
Min Zone Size: 0.15-0.20%
Only 1st Retest: Enabled
```
### Balanced (Default)
```
Momentum Body Fraction: 0.28
Min Momentum Candles: 2
BOS Required Break: 0.7
Min Zone Size: 0.12%
Only 1st Retest: Enabled
```
### Aggressive (Higher Frequency, More Signals)
```
Momentum Body Fraction: 0.20-0.25
Min Momentum Candles: 1-2
BOS Required Break: 0.4-0.5
Min Zone Size: 0.08-0.10%
Only 1st Retest: Disabled
```
## 🎨 Visual Elements
- **Red Boxes** - Supply zones (potential selling areas)
- **Green Boxes** - Demand zones (potential buying areas)
- **Dotted Midlines** - Center of each zone (fades when zone is used)
- **Debug Triangles** - Shows when zone creation conditions are met
- Red triangle down = Supply zone created
- Green triangle up = Demand zone created
## 📊 Best Practices
1. **Use on Higher Timeframes** - 1H, 4H, and Daily charts work best for institutional zones
2. **Combine with Trend** - Trade zones in direction of overall market structure
3. **Wait for Confirmation** - Don't enter immediately at zone touch; wait for rejection
4. **Adjust for Market Volatility** - Increase BOS multiplier in choppy markets
5. **Monitor Zone Quality** - Fresh zones typically have higher success rates
6. **Backtest Your Settings** - Optimize parameters for your specific market and timeframe
## ⚠️ Risk Disclaimer
This strategy is for educational and informational purposes only. Past performance does not guarantee future results. Always:
- Use proper position sizing
- Set appropriate stop losses
- Test thoroughly before live trading
- Consider market conditions and overall trend
- Never risk more than you can afford to lose
## 🔍 Data Window Information
The strategy provides real-time metrics visible in the data window:
- Supply Zones Count
- Demand Zones Count
- ATR Value
- Momentum Signals (Up/Down)
- BOS Signals (Up/Down)
## 📝 Version History
**v1.0 - Enhanced Edition**
- Improved BOS detection logic
- Extended base candle search range
- Added comprehensive input validation
- Enhanced visual feedback system
- Robust array bounds checking
- Debug signals for troubleshooting
## 💡 Tips for Optimization
- **Trending Markets**: Lower momentum requirements, tighter BOS filters
- **Ranging Markets**: Increase zone size minimum, enable first retest only
- **Volatile Assets**: Increase ATR multiplier and SL buffer
- **Lower Timeframes**: Reduce swing length, increase min bars between entries
- **Higher Timeframes**: Increase swing length, relax momentum requirements
---
**Created with focus on institutional order flow, smart money concepts, and practical risk management.**
*Happy Trading! 📈*
